Challenge: Factors that may influence the fertility desire in China
I downloaded the CGSS data version 2015 to take a detailed look into contributors for Chinese birth preference, make some primary selection on potential independent variables based on our common knowledge, then I formed a dta file. Now let me illustrate the logic why I choose those feature variables as our regressors.
There are a number of available independent factors to be chosen, taking into the feature into account, I divide the possible choices into several dimensions, such as religion, household income, education, and political orientation, the list is going on. Since I have got known about the basic direction, I just spilit this big picture into dozens of detail ones and finally, I construct a matrix that contains exactly fifty explaining variables, as well as one explained variable, the fertility desire which illustrates how many kids one wants to give birth to without One-Child policy limitation.
In my dataset the target variable is denoted as a371, and all the other facrors, discrete or not, are feature variables. I’ll put an appendix to tell the meaning of those fifty contributors. Now Let’s first look at the OLS regression result:
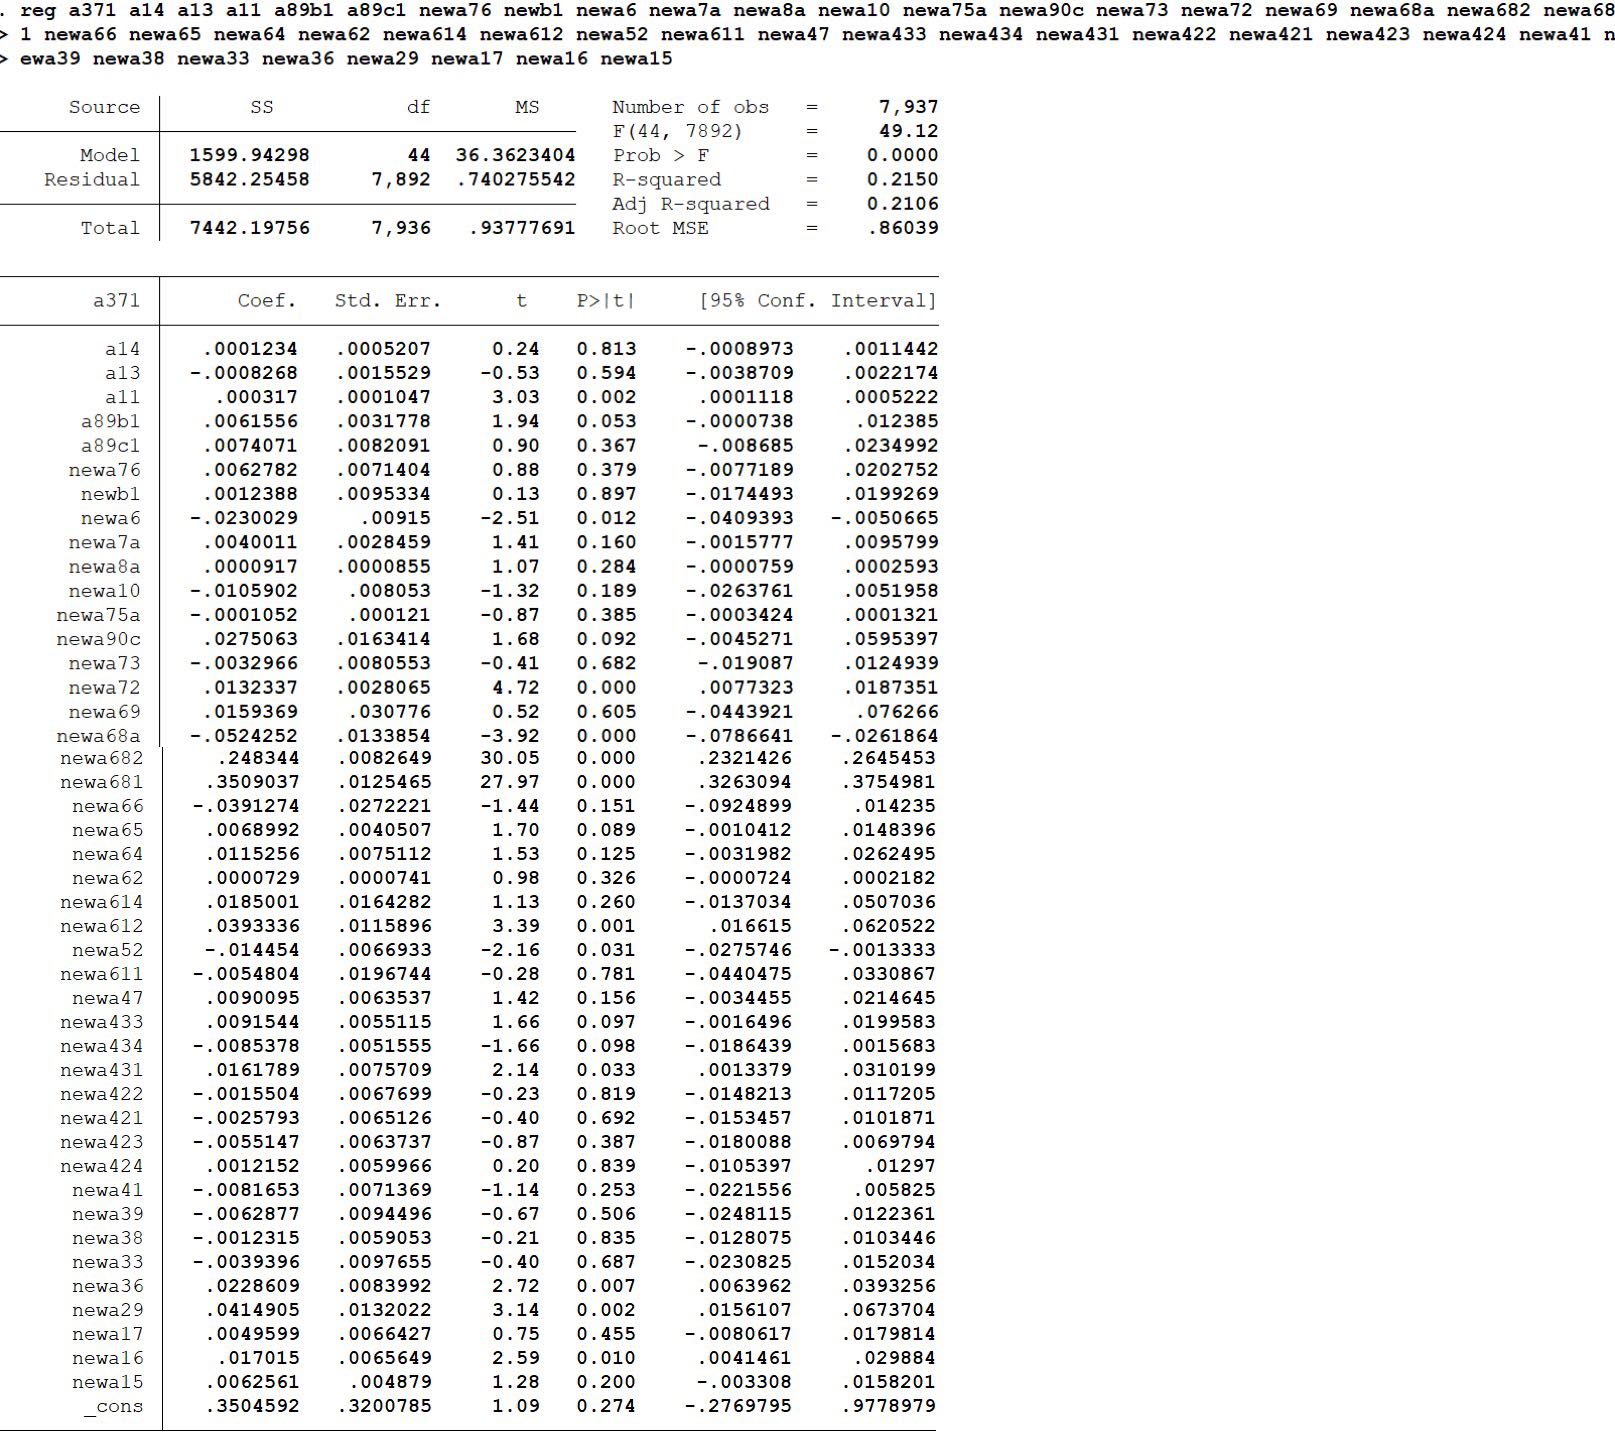
From the chart above we can conclude that dozens of explaining variables are insignificant, now we can explore what will happen if we switch to the logistic method:
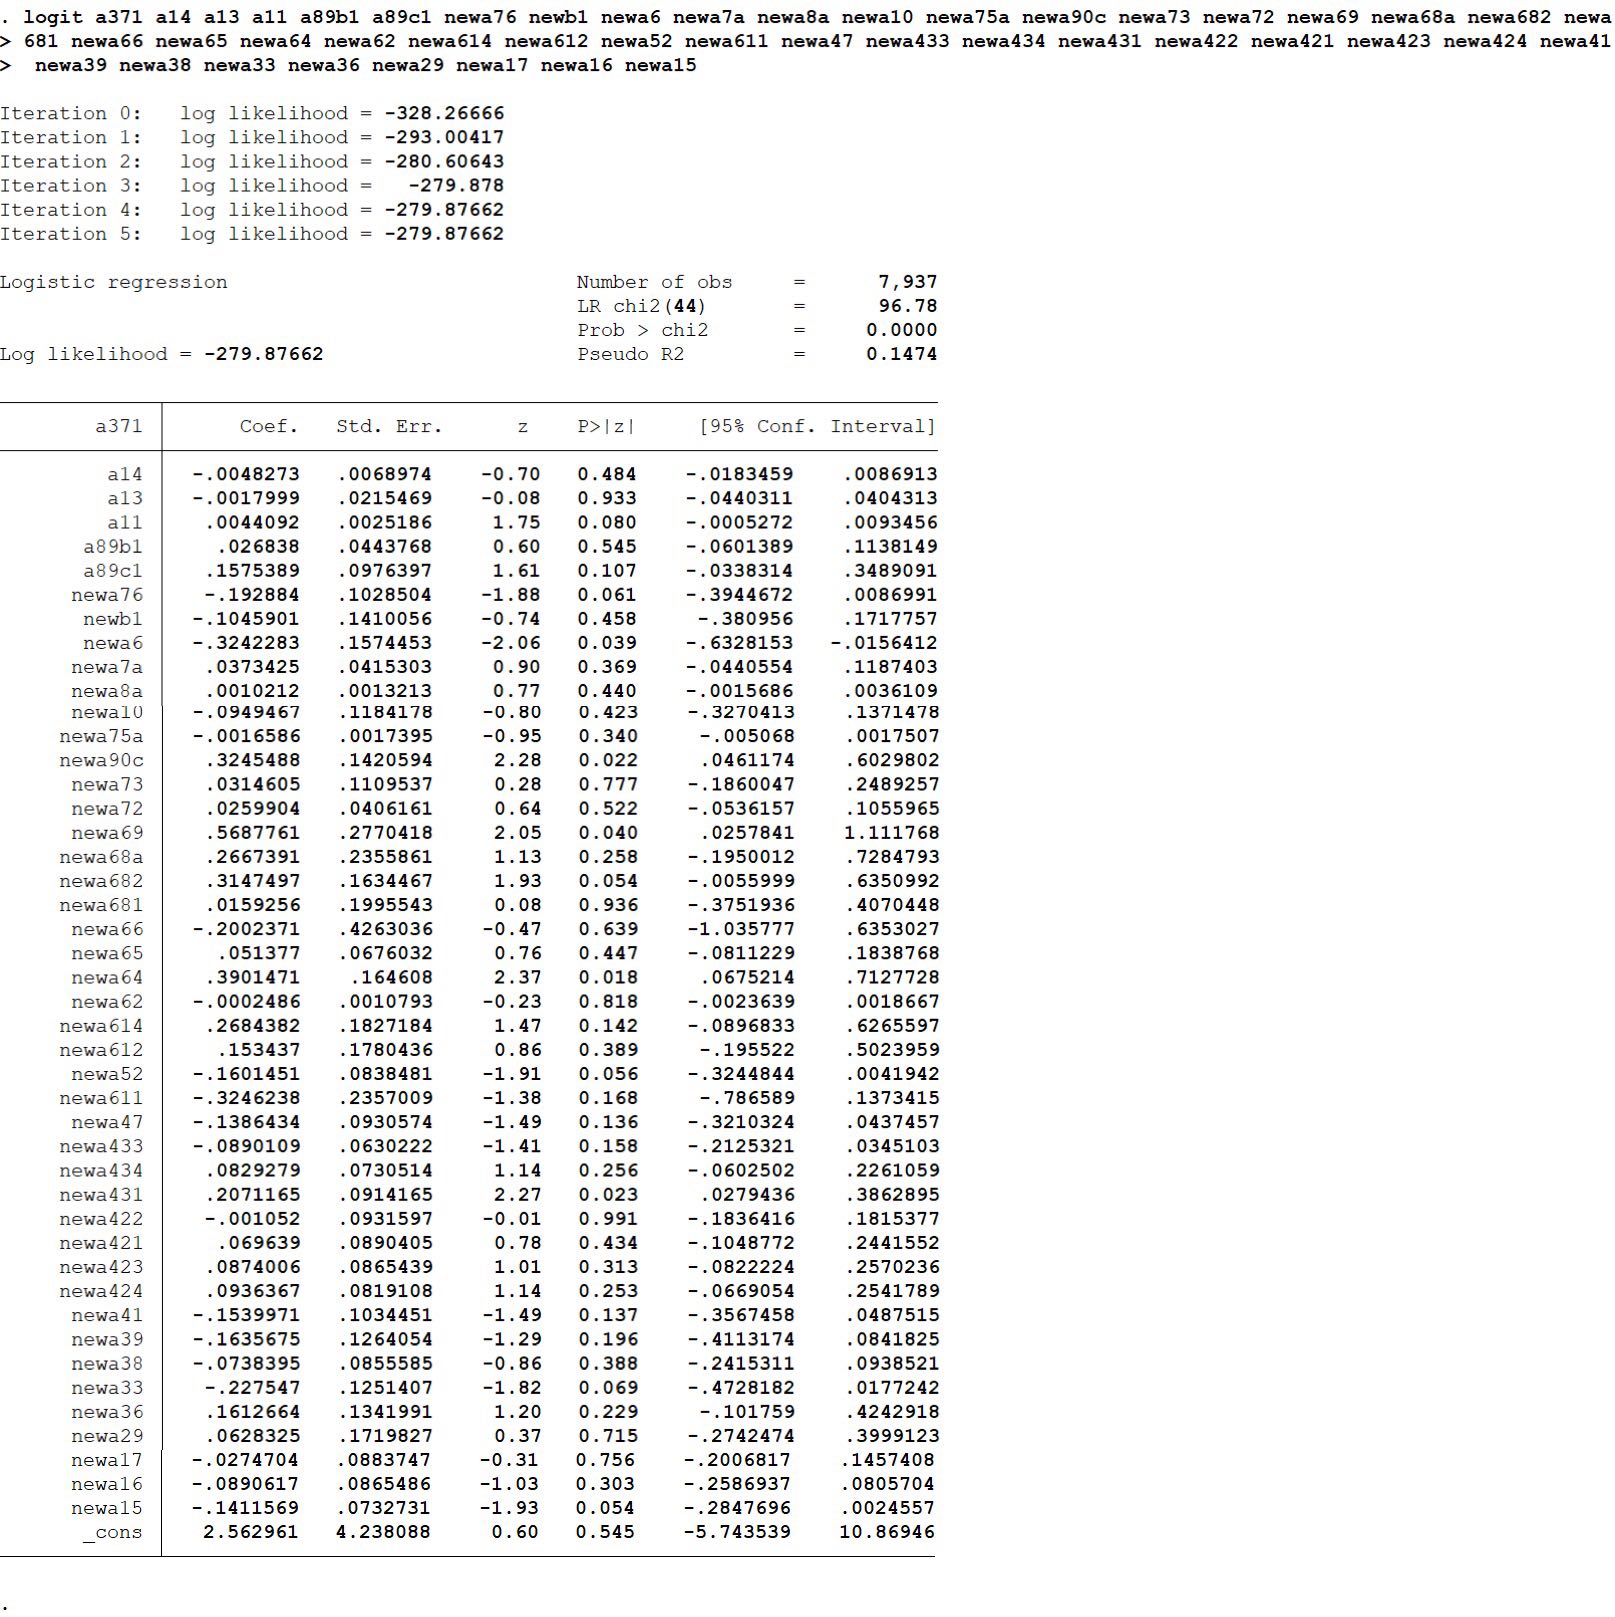
Well, the logit results are also unsatisfying. As we can see, many variables’s performance does not match my expectation, maybe a better filter mechanism is needed. Lasso and ridge method just come to my mind and I think maybe they will make a difference. To decide which one fits more here, I think maybe we can look at the relations between feature variables, so I just write:
correlate newa15 newa16 newa17 newa29 newa33 newa36 newa38 newa39 newa41 newa424 newa423 newa422 newa421 newa431 newa434 newa433 newa47 newa52 newa611 newa612 newa614 newa62 newa64 newa65 newa66 newa681 newa682 newa68a newa69 newa72 newa73 newa90c newa75a newa10 newa8a newa7a newa6 newb1 newa76 a89c1 a89b1 a11 a13 a14 a371 a372 a373
Since the table is too long to be put here, you can go and have a try by yourself if you are interested. The key is that there does exist some correlations between explaining variables but the relation is sparse and it looks like that there are too many variables, so LASSO may be better than RIDGE. The following chart shows the result.
As we can see, the Lasso method does present an inner look of those feature variables. It is clear that the fitness result will change with value of lambda, now I need to find out the best lambda which can give us the best result.
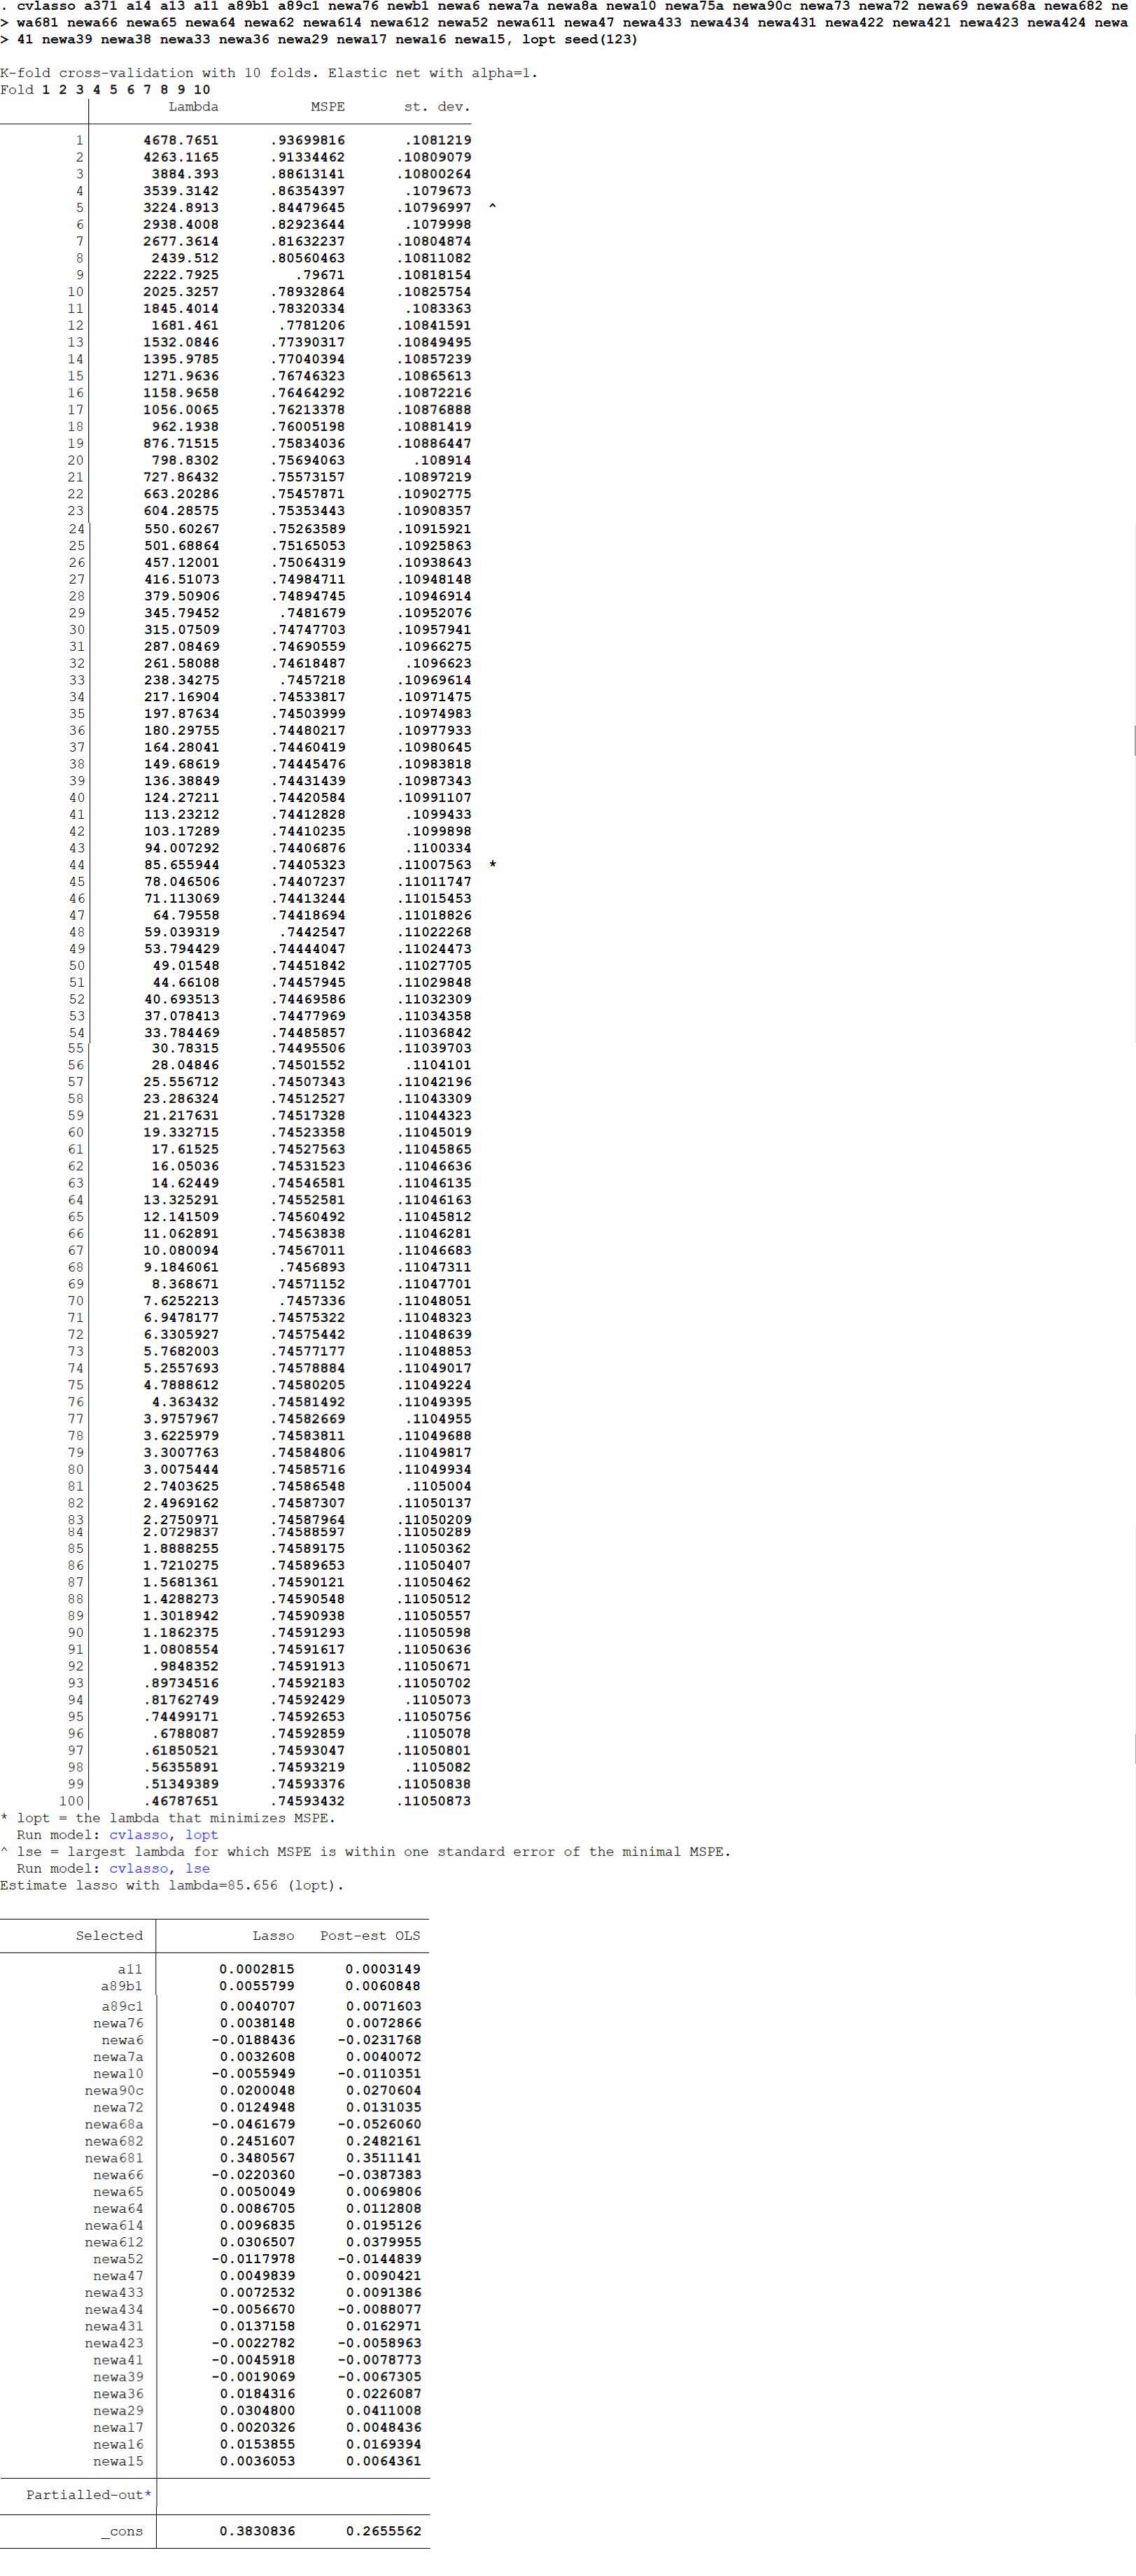
The value with star in the first chart is the outcome we are seeking for. And the following chart shows the result under the condition that lambda is equal to 85.66. We can see that there are 30 variables shown on the table, which means that twenty feature variables have zero coefficients. LASSO helps me find out the relatively important contributors. Coefficients on the right column presents the outcome before LASSO. This method always lead to a higher bias in exchange for a lower variance, usually this kind of trade-off is totally worthwhile since the decrease in variance is severer than the rise in bias.
Overall, the Chinese fertility desire was heavily influenced by several factors such as the number of boys one has already owned, the household income, the social level, etc.. More children leads to more babies, generally speaking, higher income leads to higher children preference. Moreover, we have successfully detected some useful feature variables form the useless ones, LASSO does help a lot, and I think it worth my further thoughts.